
Body
Contents of this article
- 1.Gantt chart gantt
- 2. What is a Gantt chart?
- 3. What is a Gantt chart?
- 4. What is a Gantt chart?
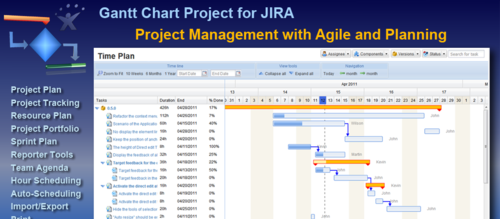
Gantt chart gantt
Gantt chart, also called bar chart. It was developed by Henry Gant in 1917. Its inner idea is simple. It is basically a line graph. The horizontal axis represents time, the vertical axis represents activities (projects), and the lines represent the planned and actual completion of activities during the entire period. It visually shows when the task is planned and how actual progress compares with planned requirements.
This makes it extremely convenient for us to figure out what work is left to do on a task (project), and to evaluate whether the work is ahead of schedule or behind schedule, or whether it is proceeding normally .
1. Why use "Gantt Chart"?
In many large and long-span engineering, marketing, e-commerce operations and other projects, there will be many constraints on personnel, time, quality, etc. In addition, cross-department collaboration is often required, so how to control the entire project management process is very important.
Using the "Gantt View" can achieve such a goal.
2. General steps of Gantt chart
(1) Clear plan and control project or product object, determine the functions and goals of the chart;
(2) Collect relevant information, such as the project’s work content and their interrelationships, the project’s Implementation conditions, etc.;
(3) Determine the work process based on the interrelationship between various tasks;
<x2 > (4) Calculate and determine the workload and duration of each operation;
(5) Determine the chart format;
(6) Use lines to mark the start and end time and continuation process of each operation on the chart.
3. How to make a Gantt chart?
1. Find the template
In Excel, open the software, or click [File] - [New ], you can see a lot of ready-made templates. Enter Gantt chart in the search box at the top of the new panel and press Enter to search. You can find this template. Of course, there are many templates. You should choose the template that suits you according to the situation of your project.
2. Create file
In the search results, click on the only available template to create an Excel table document.
3. In the table, change the title to the actual project name
4. Modify the content of activity items
The Gantt chart is a powerful tool for project management. Breaking down the project into appropriate steps is a very critical step. Once the decomposition is complete, enter the content into the Gantt chart activity column.
5. Modify the project start and end time
In this template, there are only dates of the current month. For example, it is February, and the first work plan starts on February 6th and takes 5 days to complete. Then we only need to enter the date in the planned start time, 5 days, and the template will automatically generate the progress bar on the right.
The advantage of this is that you only need to remember the time of key nodes before making, and the graphics will be automatically generated. After generation, you can adjust it according to the actual situation.
What is a Gantt chart
Gantt charts, also known as horizontal bar charts or bar charts, are used to display the internal relationships between projects, schedules, and other time-related system progress over time. Tools for drawing Gantt charts include Edraw Max, Visio, etc.
What is a Gantt chart
The Gantt Chart was developed by Henry Gantt in 1910. He used bar charts to display the internal relationships of projects, schedules, and other time-related system progress over time. Among them, the horizontal axis represents time and the vertical axis represents activities (projects). Lines represent planned and actual completion of activities over the entire period. The Gantt chart can visually show when the task plan is carried out and how the actual progress compares with the planned requirements. From this, managers can easily figure out what work is left to do for each task (project), and evaluate whether the work is ahead of schedule, behind schedule, or proceeding normally. In addition, Gantt charts are simple, eye-catching, and easy to compile. Therefore, the Gantt chart is an ideal control tool for project management. Gantt chart meaning: Displays activity in a graphical or tabular form; now a common method of displaying progress; constructed to include actual calendar days and duration, and not to include weekends and holidays in calculating progress. An example is used below to briefly illustrate the Gantt chart: time is expressed in months at the bottom of the chart, and the main activities are on the left side of the chart from top to bottom. Planning needs to determine which activities will be included in the publication of the number, the sequence of those activities, and the duration of each activity. The lines in the time box represent the planned sequence of activities, and the blank current status represents the actual progress of the activities. Gantt charts serve as a control tool to help managers detect deviations from actual progress from the plan. In this example, except for printing the long proof, all other activities are completed as planned. Advantages of the Gantt chart: Graphical summary, common technology, easy to understand; Small and medium-sized projects generally have no more than 30 activities; With professional software support, there is no need to worry about complex calculations and analysis. Limitations of the Gantt chart: The Gantt chart actually only partially reflects the triple constraints of project management (time, cost and scope) because it mainly focuses on process management (time); Software deficiencies. Although the internal relationships of project activities can be depicted through project management software, if there are too many relationships, the complicated line diagram will definitely increase the difficulty of reading the Gantt chart; in order not to divert the reader's attention, it is best to avoid using grid. In addition, the personal Gantt chart and the schedule we usually use are two different ways of expressing tasks. Personal Gantt charts allow users to intuitively know which tasks are to be done in which time periods, while timesheets provide more precise time period data. In addition, users can update task progress directly in the schedule. To create a Gantt chart, there are specialized software such as Ganttproject, Gantt Designer, Microsoft Project, etc. Of course you can also draw it manually in Microsoft Excel. .
What is a Gantt chart
A Gantt chart is actually a line chart. Generally, the horizontal axis represents time, the vertical axis represents activities, and the lines represent the arrangement and completion of activities during the planning period. The Gantt chart makes the plan, progress and other information of the task clear at a glance. Therefore, through the Gantt chart, managers can have a clearer understanding of the stage at which the task has been completed and what work is left. Moreover, managers can also check the quality of which part is completed and whether the construction period will be delayed. In short, the Gantt chart is a more advanced chart used for project management. The most famous Gantt chart control at present is XGantt. The most direct way to understand the Gantt chart is to search for pictures of the Gantt chart, and the characteristics will be clear at a glance.
The above is all about gantt, Gantt chart gantt, and gant related content. I hope it can help you.